7Breaths is born

app-storegoogle-play

Respiratory rate needs to be measured over one minute?

A fundamental part of medical practice is the measurement of primary physiology. For centuries heart and respiratory rates have been calculated to help identify disease and demonstrate response to treatment. However confidential enquiries, internal reviews and other studies frequently show that observations are poorly taken. This in part has lead to an inexorable rise in early warning scores and system to identify acute illness. A potential barrier to the recording of observations, whether by doctor, nurse or other health professional is the time taken to measure them. Traditionally a minute has been the gold standard in order to ensure reliability. Studies have supported the 60s approach (Simoes 1999) but with increasing pressures on health services and rapid advances in easy to access technologies the time has come for a review. Can you help?

Take part in a large scale observational trial using your smartphone

This idea was first in my previous post here, tweeted and published on the NHS Hackday googlegroup . This idea was quickly picked up by Neville Dastur, a Consultant Vascular Surgeon, software developer and owner of Clinical Software Solutions Ltd and 7breaths was born.

What are we going to do with the data?

The data will be openly available to data analysts and mathematicians to attempt to generate an algorithm that can be used in future version of 7breaths that will automatically report the respiratory rate once the software is ‘confident’ that it is able to predict within set level of confidence what the respiratory would be at 1 min.

We envision that this will take into consideration

  • Inter-breath duration
  • Variability and pattern of the Inter-breath duration

Why bother with this?

Ultimately this is a demonstration of the power of open source, collaborative healthcare innovation. While it is a bit of fun there is a real possibility that new methods to improve the accuracy of RR measurement and that can also save time could transpire. It’s also a demonstration that a simple piece of software may enable an economical way of gathering data at the point of care that does not require any form of duplication of efforts.

Want to take part?

Download the App

google-play app-store

Register

When you first download the app, you have the option of registering the software. We would encourage this as it would allow us to acknowledge your contribution and also provides a degree of provenance for the data collected.

Start collecting data

When you are next counting a patient’s respiratory rate, use 7breaths instead. At the end of one minute it will report the respiratory rate and it will give you an option of sending the data to us. That’s it!

Who’s behind 7 breaths?

Damian Roland – Paediatrican (@damian_roland)
Wai Keong Keong – Haematology Registrar (@wai2k) <- ME
Neville Dastur – Vascular Surgeon (Clinical Software Solutions) <- He built the app! (Sourcecode on GitHub)

VitalVis – Re-imagining the Observation Chart for the Digital Age [NHS Hackday 4 – London Edition]

logo

For NHS Hackday 4 – London Edition. I wanted to work on a design hack to solve the following challenge.

How to display 5 days worth of patient bedside observation data on a small smartphone sized screen.

Digital collection of routine observations (Blood pressure, Heart Rate, Respiratory Rate, Oxygen Saturations and Temperature) is becoming more common place in the acute hospital setting. The advantages of automated calculation of Early Warning Scores (EWS) and automated notifications to the clinical team and Patient At Risk Team (and related early intervention teams) are undeniable.

However, displaying of a large amount of patient observations to allow comparison of trends in a small smartphone sized screen remains problematic. Doctors are very used looking at patterns and trends very quickly. The way this is represented on smartphone sized screens currently makes this difficult.

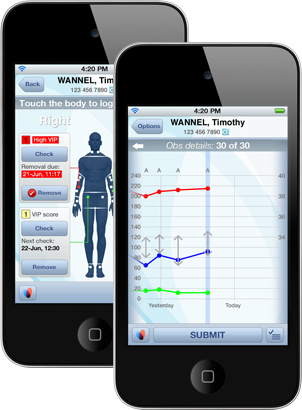
iPods

The example above is taken from a leading provider of bedside observations systems. As you can see, the number of observations is quite limited and getting previous observations require a significant amount of scrolling and does not allow direct comparison with the current set of observations. This is a significant disadvantage compared to paper.

Inspired by Edward Tufte

Inspired by the father of data visualisation, Edward Tufte and his paper co-authored by Seth Powsner article (“Graphical Summary of Patient Status”, The Lancet 344 (August 6, 1994), 386-389), the Superteam (see below) produced the following solution:-

Iphone5 with VitalVisThis design shows:-

  • A total of 5 days of observational data:- The last 24 hours is shown in the right half where as the previous 4 days is shown on the left hand side of the screen.
  • The right  area of the screen shows the most recent set of observations
  • Horizontal Gray bars demonstrate ‘safe ranges’
  • Numbers incorporated in the middle divider helps orientates viewer

Principles of the design:-

  • Minimal use of colours
  • Maximising the data-to-ink (pixel ratio)
  • Variable X-axis with emphasise on the last 24 hours
  • Use of dots or lines to represent trends instead of ‘artificial’ lines
  • Relies of the natural ability of the human mind to quickly process large amount of information using pattern recognition

This also allows:-

  • In a larger screen like a tablet or computer monitor, this allows one to view observations from multiple patients at the same time, allowing a quick overview of multiple patients
  • Incorporation into a patient dashboard

The technical implementation

To turn this idea into reality, we were fortunate to have anonymised real patient level data collected by Wardware provided by Rob Dyke (@robdykedotcom) of Taxtix4 in the form of an mySQL database. In the short amount of time available to create the, the Superteam managed to create a webapp that can query this database and display it on a webpage. The technology stack: Python, Django, Mathlib library. Screenshot below. [30/05/2013: An updated version 48 hours post hackday could be found here ]

ScreenShot_01

To my knowledge this is the 1st ever project at any of the previous NHS Hackday to use actual patient data. I strongly believe that one cannot build good systems without using realistic data.

The Superteam

This project would not be possible without the skills, professionalism and dedication of the following amazing people:-

  • Martin Green – Radiation Physicist and Coder
  • Alan Beebe – Coder
  • Chris Pritchard (@chriscpritchard) – Student paramedic and Coder
  • Ayesha Garrett (@londonlime) – Designer
  • Amanda (@complexitytamer) – User Experience Designer
  • Wai Keong Wong (@wai2k) – Haematologist <- ME!

Collaborate and other Resources

The code if available on GitHub

Presentation is available on SlideShare

logo

Using NHS.net Email to store notes using the Drafts folder

I realised that I needed to keep some working notes with patient identifiable information with me that I can access on any computer.

Given that NHS.net is the only way to store patient information securely, I thought of a simple solution that might work for you.

Use the ‘Drafts’ Folder

To create a draft

  1. Create a new message but don’t put anyone in the To: Cc: field
  2. Give your note a Subject
  3. Create your note in the body
  4. Click ‘Save’

That’s it.

When you want to access the notes again

  1. Go to your ‘Drafts’ folder
  2. Open the ’email’
  3. Update your notes
  4. Click ‘Save’

As NHS.net doesn’t currently provide a way of storing files, this is a quick ‘hack’ that is IG compliant.

What about text formatting?

If you do not access your NHS.net using IE or Outlook, you loose the ability to use formatting for your text. As an alternative, I suggest using ‘Markdown‘. If you ever choose to format the text, you can convert the markdown text into PDFs, HTML etc…

What about getting this on my phone?

You can access your ‘Drafts’ on your iOS device if you are linked to NHS Mail using Exchange. However, you won’t be able to edit mail in your drafts folder. However, what you can do is create an email, send it to yourself, and then move it into the ‘Drafts’ folder. (Don’t make the mistake of moving it into the ‘Drafts’ folder for phone but the ‘Drafts’ of your NHS.net account.

Hope this helps

Getting Google Chrome (sort of) working on NHS computers

As we are all aware, more NHS computers run on IE7 and some even on IE6.

I would like to share with you how I managed to get Chromium working on my NHS computer without having admin rights.

This is made possible by SRWare Iron: A browser that is based on the free Sourcecode “Chromium” that powers Google’s Chrome browser.

Download the Portable-Version for USB-Sticks and as it says on the website, “no Installation; no Admin-rights needed; Profiles in the same folder”

Unzip it in the directory of your choice, click on ironportable.exe and aware you go! Yup, it is really that easy.

Another advantage of using SRWare Iron is that there is no privacy concern. Read more Chrome vs Iron.

Potential pitfalls and suggestions:-

  1. SRware website may be blocked by your web filters.
  2. Even if you saved it to your Dropbox or alternative, those websites may be blocked too (my hospital does not block dropbox and this is how I managed to get the zip onto my work computer.
  3. You could email the zip file to you computer but some NHS email filters may block that too!
  4. You could use your work’s encrypted USB stick but your personal unencrypted USB stick will probably not work.

Tips:-

  1. ‘Installing’ SRware’s Iron onto your personal directory allows you to use it on any computer that you login into.

What I’ve yet to figure out

  1. Does installing it on your personal directory start bloating your personal directory and fill it up?

Thank you to @haematologic for sharing this with me.